This article is based on the design draft and assessment sheet for AI4SE team maturity model v0.3.5, aimed at engineering managers, effectiveness leads, and consultants who need to diagnose current-state maturity, produce evidence-based scores, and drive continuous improvement within an organization. The companion assessment sheet is oriented toward capability profiles and risk-item output, and does not compute a team total score.
The most dangerous habit in a clinic isn’t “not knowing how to prescribe” — it’s “prescribing the same drug at the same dose for every case that looks like a cold.”
AI4SE transformations have the same failure mode: once every team has a coding agent installed, everyone gets the same workflow template, the same training course, the same “autonomy” target. The usual result: the tooling layer looks busy, but process and human-agent collaboration contracts haven’t kept up — or the basics aren’t even in place yet, and the team is already chasing an L4/L5 systematized narrative.
The key point of maturity assessment isn’t slapping a level label on a team — it’s that teams at different maturity levels need genuinely different improvement plans. Even if every team eventually needs to add “evidence-driven review,” the set of actions and the investment dose differ between going from L2 to L3 versus L3 to L4. The model exists to find capability gaps, then prescribe an AI4SE capability-building plan through differential diagnosis, case by case.
This article explains why the model is designed this way, how leveling works, and how to read assessment output as a “prescription by type.” The complete L1–L5 behavioral anchors for each capability item are governed by the assessment sheet; this article retains only the design logic and the reading method.
I. Why a Team-Level Maturity Model Is Needed
Buying tools, running training, and announcing “full AI embrace” are all easy to turn into mere activity. The hard part is answering three questions:
- What is stably happening right now? Not what’s written in the plan, and not what was demoed.
- Where exactly is the weak spot? Unclear effectiveness goals? Unchanged process? No established methods? Unbounded tooling? No collaboration contract? No organizational soil?
- What “medicine” should be prescribed next, and at what “dose”? Keep stacking tools, or first fix the gates and the chain of accountability?
DORA, SPACE, and DevEx answer “what happened in delivery and experience.” The layered technology model answers “what structure should we use to understand engineering capability.” The maturity model fills the third gap: the team’s current profile across AI4SE capability domains, and the improvement priorities that follow from it.
It deliberately avoids four things:
| What It Avoids | Why |
|---|---|
| A single team total score | An average masks the critical weak spot; “total score 3.2” doesn’t tell you what to fix next week |
| Team rankings | Assessment serves improvement, not competition |
| Fixed-timeline maturity commitments | The model supports re-assessment, but doesn’t bake in “must reach L4 in three months” |
| Binding to a specific vendor/framework | It assesses capability, not a procurement checklist |
II. Model Positioning: Diagnostic Profile, Prescriptive Output
The model assesses a team’s current capability profile with respect to AI4SE, identifies gaps, and provides an evidence base for continuous improvement. It is not tied to a single project context, and does not judge teams by a single total score.
Should output:
- Capability-domain profile: maturity distribution across each of the six domains
- Capability-item heatmap: L1–L5 status for the 18 capability items
- Evidence strength and scoring confidence: whether the score is reliable
- Bottleneck items and evidence gaps: why a higher level can’t be assigned
- Continuous-improvement recommendations: next-step direction based on the gaps
Should not output: a total score, a ranking, a timeline-based leveling commitment, or a mandate for a specific tool.
In one line:
Assessment is differential diagnosis; the prescription is a capability-building plan matched to the weak spots and evidence gaps.
III. Design Principles
| Principle | Description |
|---|---|
| Current-state scoring | Only score practices that are already stably happening — not plans, visions, or one-off demos |
| Evidence first | Scores are based on observable facts, artifacts, process records, system data, and cross-validated interviews |
| Team consistency | One person achieving something doesn’t mean the team can; individual practice typically caps at L2 |
| Score to the lower bound | If only some conditions of a higher level are met, score at the highest level whose conditions are all stably satisfied |
| Capability, not tooling | Anchors describe what capability the team has, not which vendor or framework is hardcoded |
| Re-assessable | The same model can be reused in later cycles, but doesn’t bake in a fixed time target |
| No total score | Output is profile, bottlenecks, and improvement recommendations — not a ranking score |
These principles all serve one purpose: making the “prescription” rest on verifiable facts, not slogans or gut feel.
IV. Capability Structure: 6 Domains × 18 Items
The model uses 6 capability domains and 18 capability items, aligned with the AI4SE layered technology model: the Effectiveness foundation, the three layers of Process / Methods / Tools, the Harmony cross-cutting layer, and organizational/cultural support.
| Domain | Capability Domain | Focus | Capability Items |
|---|---|---|---|
| D1 | Effectiveness Foundation | Quality + Efficiency + Value | Value goals and outcome hypotheses; quality and trust baseline; efficiency and flow measurement |
| D2 | Process Layer | Auditable closed loop for human-agent collaboration | AI4SE workflow design; small-batch task decomposition; evidence-driven review/ship gates |
| D3 | Engineering Methods & Work Discipline | Reusable, trainable, verifiable methods | Spec formalization; context organization; verification and evidence discipline |
| D4 | Tools Layer | Agent runtime, context, and automated verification | Agent runtime and permissions; AI-accessible engineering context; automated verification and toolchain integration |
| D5 | Harmony (Human/Agent Collaboration) | Collaboration contracts cutting across all three layers | Collaboration responsibilities and independent verification; HITL/HOTL/HOOL risk routing; accountability and audit trail |
| D6 | Organization & Culture | Sustained adoption and team learning | Practice champions and training; community and knowledge assets; adoption confidence and behavior change |
The structure itself hints at “differential typing”: if D4 is clearly ahead of D2/D5, the typical prescription isn’t buying an even stronger agent — it’s filling in workflow, gates, responsibilities, and risk routing. Otherwise, the stronger the tooling, the faster it outruns governance.
Mapping to Reference Frameworks
| This Model | Corresponding Source |
|---|---|
| D1 Effectiveness Foundation | AI4SE Effectiveness Focus; DORA Value/Flow perspective |
| D2 Process Layer | Pressman Process; Research → Plan → Execute → Review → Ship |
| D3 Engineering Methods | Pressman Methods; SDD, Agentic Engineering, Harness, and other stable capability abstractions |
| D4 Tools Layer | Pressman Tools; agent runtime, permissions, context, automated verification |
| D5 Harmony | Harmony cross-cutting layer; HITL / HOTL / HOOL supervision spectrum |
| D6 Organization & Culture | Adoption, training, communities of practice, and other organizational soil |
The measurement frameworks (DORA / SPACE / DevEx) tell you “how well outcomes and experience are going”; the maturity model tells you “where the capability structure is missing, and what to fill in next.”
V. Level Semantics: L1–L5
The primary labels use L1–L5. If alignment with Microsoft’s CMM-style naming is needed, they can be mapped to L100–L500.
| Level | Name | General Leveling Semantics |
|---|---|---|
| L1 | Initial | Practices are scattered, individual, non-repeatable, lacking team standards and evidence |
| L2 | Tooled | Localized practices or preliminary rules exist, but rely on individual experience; weak team consistency and governance |
| L3 | Engineered | Clear standards, role responsibilities, required artifacts, and review mechanisms are established and repeatable |
| L4 | Systematized | Standards are embedded in process and toolchain, key data is traceable, and a continuous-improvement loop exists |
| L5 | Autonomous | Within clear governance boundaries, low-risk paths run stably and automatically, exceptions escalate, decision evidence is traceable, and continuous optimization is driven by operational data |
Note: L2’s “Tooled” is shorthand meaning AI4SE has moved from scattered ideas into localized practice or preliminary rules — it does not mean only tool procurement is assessed.
For “prescribing,” the gap between levels matters more than the absolute score:
- Most capability items stuck at L1–L2: prioritize building team standards, templates, execution records, and evidence discipline, rather than chasing an autonomy narrative.
- Most already at L3, some pushing toward L4: embed standards into the task system, review gates, and toolchain, so that missing evidence actually blocks delivery.
- Tools high, process/Harmony low: fix the collaboration contract and gates first, before expanding agent permissions.
The same “drug” (e.g., evidence-driven gates) needs a different dose: L2→L3 is usually “require a change description / test / risk note before review”; L3→L4 is “missing evidence blocks or delays delivery, and must be embedded in the toolchain.”
VI. Evidence-Based Leveling: Making the Prescription Verifiable
1. The Five-Step Leveling Method
Final level = the highest level whose necessary conditions are met, constrained by evidence strength, team coverage, and cap rules.
- Confirm current stable practice: only look at behavior that is already happening stably.
- Compare against behavioral anchors: choose the L1–L5 description closest to the current facts.
- Check necessary conditions: if conditions are incomplete, drop to the highest level whose conditions are fully met.
- Apply cap rules: cap based on evidence strength, coverage, execution records, and the “boundary of ordinary engineering practice.”
- Produce the final interpreted level: record the evidence summary, AI4SE incremental evidence, evidence gaps, confidence, and improvement recommendations.
The v0.3.5 assessment sheet uses expert consultant scoring as the primary maturity input; what ultimately enters the dashboard is the final interpreted level, capped by evidence and coverage rules — not a subjective gut-feel score.
2. Evidence Strength and Coverage Caps
| Evidence Strength | Meaning | Cap Tendency |
|---|---|---|
| Low | Personal description, single case, unverifiable screenshot | Usually caps at L2 |
| Medium | Some documentation/interviews/limited samples, but insufficient continuity or coverage | Usually caps at L3 |
| High | A complete work cycle or 4+ weeks, multiple samples, multiple sources, linkable to work artifacts | Only this qualifies for interpreting L4/L5 |
| Coverage | Meaning | Cap Tendency |
|---|---|---|
| Individual | A few members can do it | Usually caps at L2 |
| Subgroup | A single role or localized scenario | Usually caps at L3 |
| Team | Main delivery roles and key steps use it stably | Baseline threshold for L3+ |
| Cross-team | Multiple teams share governance and knowledge mechanisms | Signal of organizational-level diffusion |
3. AI4SE Incremental Evidence
Ordinary PR, CI, Git, and test records can serve as baseline evidence, but cannot by themselves prove AI4SE maturity. The assessor must be able to explain:
- Which step AI was involved in;
- How the team adjusted process, verification, permissions, responsibility, or knowledge assets as a result;
- Whether these adjustments can be independently verified.
Without incremental evidence, it’s easy to mistake “we’ve always had CI” for “we’ve already systematized AI4SE” — and the prescription will be wrong too.
4. Boundaries Between Adjacent Capability Items
To avoid the same piece of evidence being reinterpreted repeatedly, assessment should distinguish:
| Capability Item | Primarily Assesses | Does Not Substitute For |
|---|---|---|
| D2.3 Evidence-driven gates | Whether evidence is required before review/delivery, and whether missing evidence blocks delivery | Not a substitute for D3.3 verification discipline, nor D5.3 accountability chain |
| D3.3 Verification and evidence discipline | How AI output is verified and what evidence is retained | Not automatically high-scored just because ordinary CI exists |
| D4.3 Automated verification and toolchain | Whether AI-assisted changes are identifiable and enter a unified verification pipeline | Not a substitute for gate decisions or human accountability |
| D5.1 Collaboration responsibility and independent verification | Human/agent responsibilities, handoff points, whether verification is independent of the generating party | ”Everyone eyeballed it” ≠ automatic high score |
| D5.3 Accountability and audit trail | Whether who approved, who verified, who merged, who is accountable is traceable | Ordinary code review records ≠ AI4SE accountability chain |
Clear boundaries make weak spots clear; clear weak spots make the prescription avoid becoming “one drug for every disease.”
VII. From Profile to Prescription: Same Disease, Different Treatment
The product of a maturity assessment isn’t the radar chart itself — it’s the differentiated, executable improvement plan. Below are three common profile types to illustrate “differential typing” — all of them might be verbally described as “the team is using AI,” yet the prescriptions are completely different.
Type A: Tools Ahead, Process and Harmony Weak
Profile characteristics: D4 is relatively highest; D2 and D5 clearly lag; L1/L2 items cluster around workflow, risk routing, and accountability records.
Wrong prescription: keep buying stronger agents, expand auto-code-change permissions, use tool-usage rate as a success metric.
Matched prescription:
- First define a team-level AI4SE workflow and small-batch task standard (D2.1 / D2.2);
- Establish evidence-driven review/ship requirements (D2.3), aligned with verification discipline (D3.3);
- Clarify responsibilities, independent verification, and HITL/HOTL/HOOL risk routing (D5);
- Tool-permission expansion must follow the collaboration contract, not precede it.
Type B: Stuck at L1–L2 Across Many Domains
Profile characteristics: widespread L1/L2 across the board; occasional individual experts; knowledge scattered across chats and personal notes.
Wrong prescription: benchmark directly against “autonomous agent teams,” adopt complex multi-agent orchestration.
Matched prescription:
- Pick a few high-value scenarios and build repeatable spec/context/verification templates (D3);
- Identify practice champions and provide role-based coaching rather than one-off training (D6.1);
- Turn success and failure patterns into team knowledge assets (D6.2);
- Target repeatable engineering (L3) first, before talking about systematization.
Type C: Most Items Near L3, Some Pushing Toward L4
Profile characteristics: standards and execution records already exist; what’s missing is toolchain embedding, data closed-loops, and decision influence.
Wrong prescription: run another round of “awareness-raising” training, or use satisfaction surveys as a substitute for engineering change.
Matched prescription:
- Embed evidence requirements, permissions, and verification results into the task system / PR / release gates (D2 / D4);
- Let metrics influence prioritization and governance decisions, not just retrospective reporting (D1);
- Bring the accountability chain and risk routing into auditable records (D5.2 / D5.3);
- Use re-assessment to verify “have low-maturity items been cleared,” not just whether domain averages rose.
”Same Drug, Different Dose” Example
Take D2.3 Evidence-driven review/ship gates as an example:
| Current Rough Position | Next Dose of Improvement | Success Signal |
|---|---|---|
| L1–L2 | Define a required evidence checklist before review, and leave execution records on real tasks | Shift from “self-reported” to “a stable evidence format exists” |
| L2–L3 | Evidence requirements become team consensus; gaps are flagged and filled | Consistent execution visible across multiple real delivery samples |
| L3–L4 | Evidence requirements are embedded in gates; missing evidence blocks or delays delivery | Gate-failure records are queryable and affect real delivery |
| L4–L5 | Gate strictness adjusts dynamically by risk, change type, and historical quality | Operational data proves the dynamic policy is effective |
If an assessment gives a single “D2.3 = L2” score but prescribes “add a dynamic gating engine,” that’s a classic dosage error.
VIII. How to Use the Assessment Sheet (v0.3.5)
The formal assessment sheet collects the 18 capability items, behavioral anchors, necessary conditions, suggested evidence, cap rules, and evidence fields on the same scoring page. The recommended pace for the consultant version:
- Fill in expert consultant scores based on interviews, evidence, and delivery records; when facts are unknown, mark “unclear/no evidence” rather than defaulting to L1.
- Read the L1–L5 anchors, necessary conditions, and cap rules in each capability item’s notes.
- Add an evidence summary, evidence type, AI4SE incremental evidence, sources/links, and sample period.
- Fill in the evidence score, evidence strength, team coverage, confidence, evidence gaps, and improvement recommendations.
- Review rule-conflict warnings and the final level: when the consultant’s score exceeds the “suggested maximum level,” it is explained by the evidence-capped result.
- Use the dashboard to view the capability-domain profile; use the risk register to aggregate low-maturity, low-evidence, low-coverage, and incremental-evidence-gap items.
The dashboard defaults to the final interpreted level, does not use the average score as a team total, and does not rank. Domain averages are only used to view the overall shape; decisions should still look at the lowest-scoring items, the count of L1/L2 items, risk items, and evidence gaps.
IX. Reading Assessment Output: A Mock Walkthrough
The charts and data below are reproduced from a visualization mock (ai4se-maturity-visualization-mock-v0.1): the radar chart shows overall shape, the bar chart shows domain differences, the improvement bars show the effect of actions taken, and the heatmap shows individual capability items. All data is simulated and does not represent a real team or a maturity commitment — it’s used here to demonstrate “read the chart → diagnose the type → prescribe.”
1. Start With the Dashboard’s Key Signals
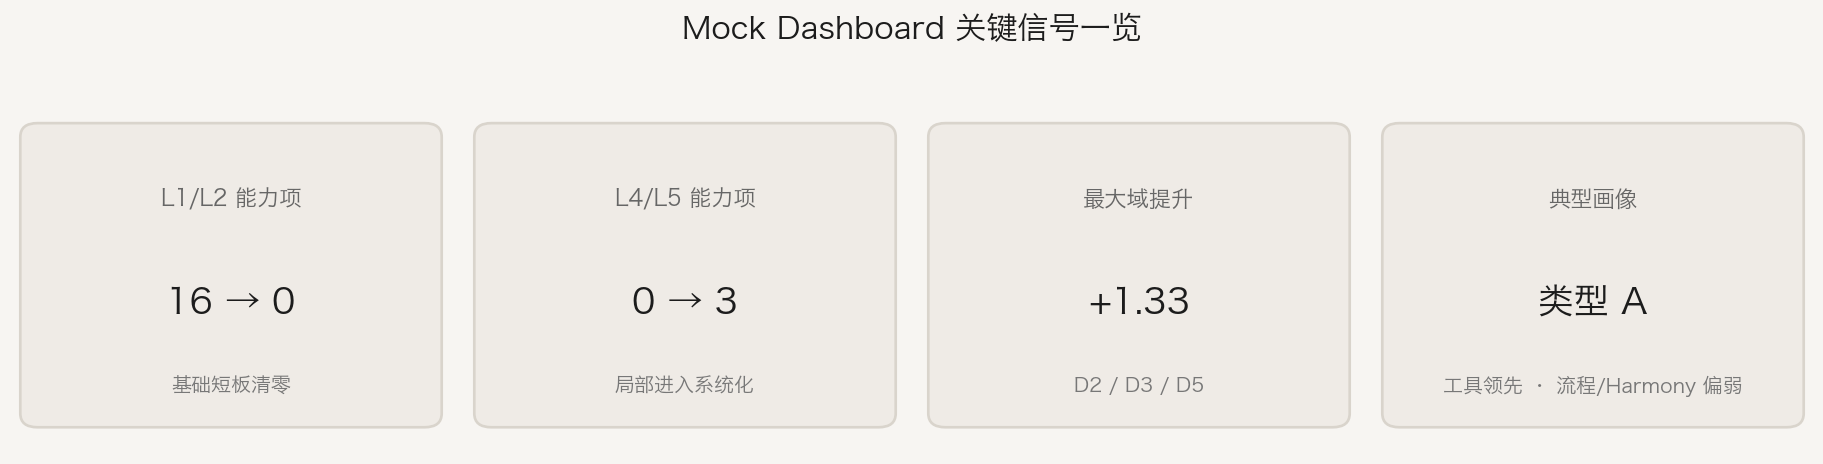
Four things you can read at a glance: whether L1/L2 items form a cluster, whether any L4/L5 already exists, which domains changed the most, and which typical profile type currently applies. In this example, the first assessment is flagged as Type A: tools ahead, process/Harmony weak — that’s already a prescription direction, not just a score summary.
2. First Assessment: A Typical Structural Imbalance
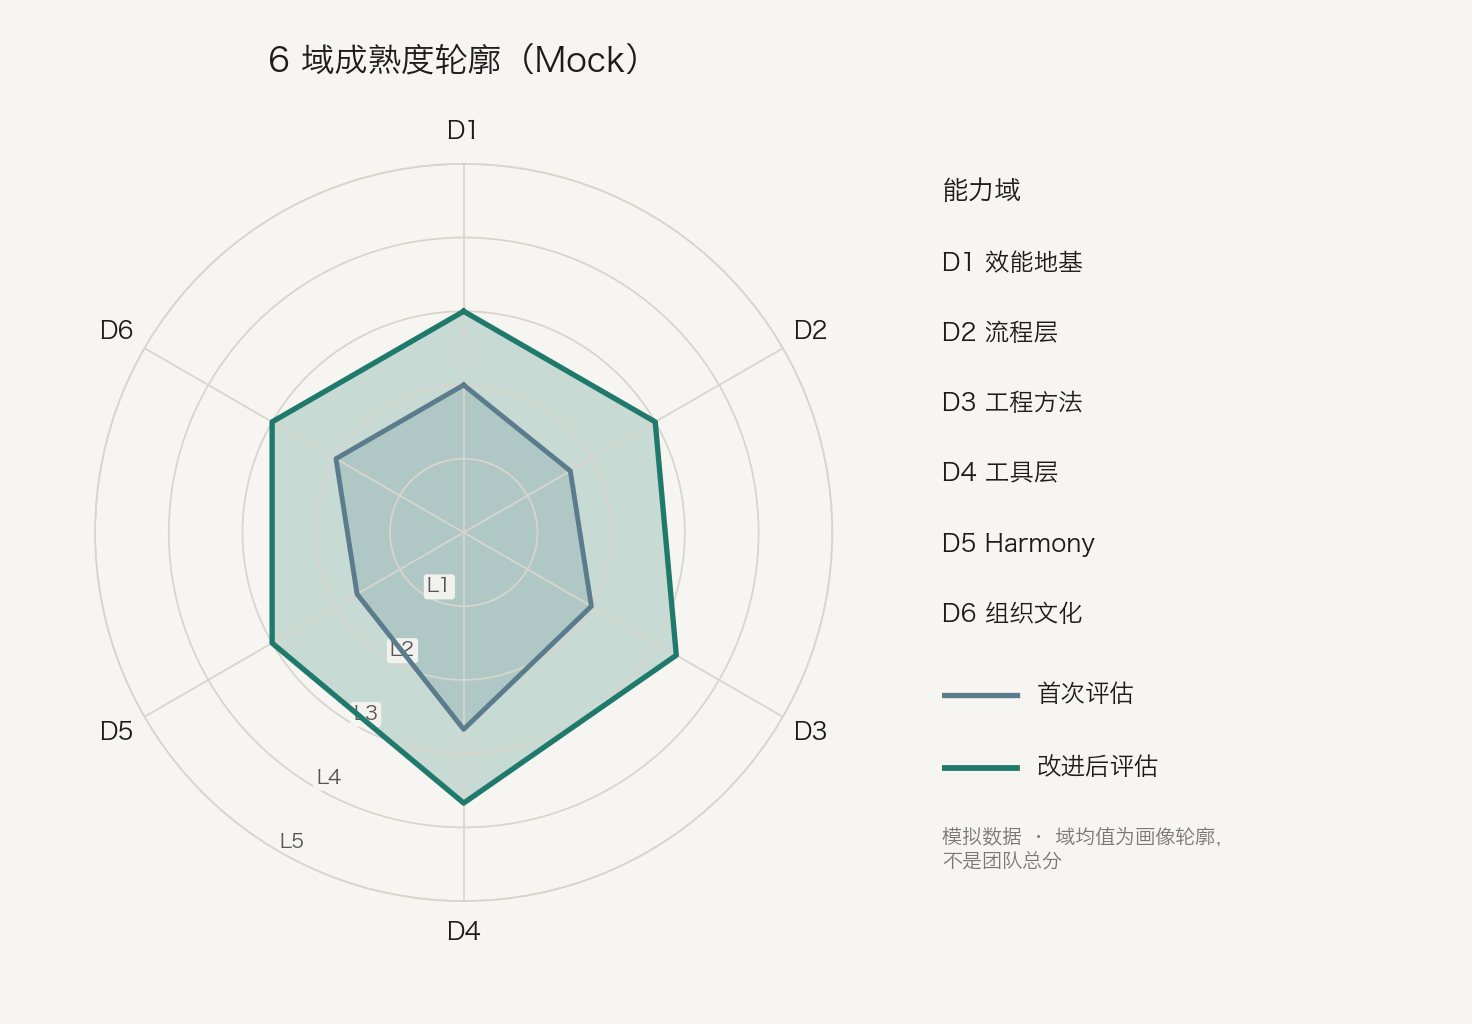
On the radar chart, the gray “first assessment” contour sits close to L2 overall, with only D4 Tools Layer clearly extended outward; the teal “after improvement” contour is rounder and further out. When reading the first-pass contour, the key point isn’t “what’s the average” — it’s whether the shape is imbalanced.
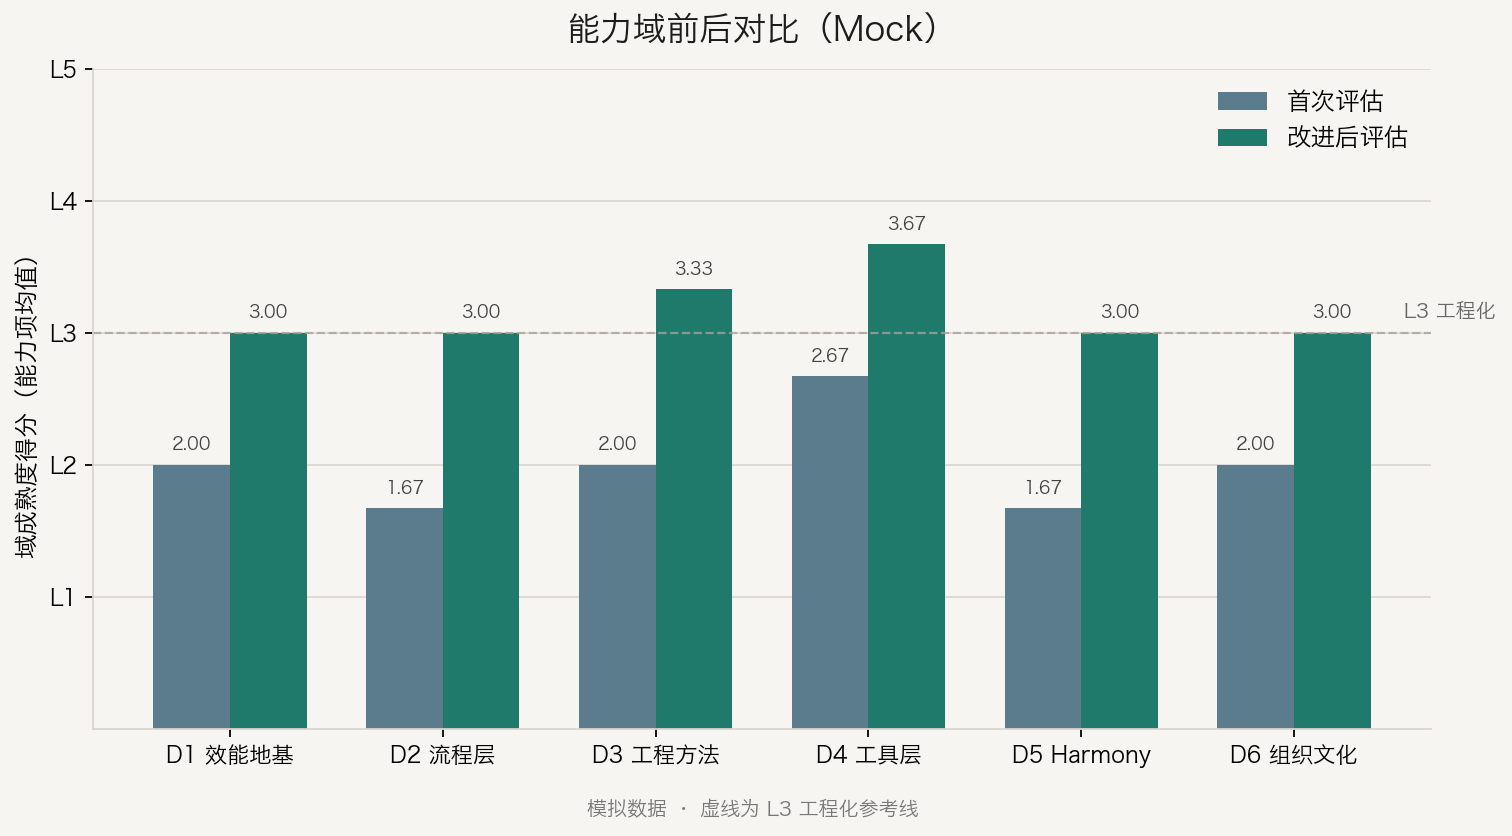
| Domain | Capability Domain | Domain Profile (mean) | Interpretation Clue |
|---|---|---|---|
| D1 | Effectiveness Foundation | 2.00 | Some local goals/gut sense, not yet engineered |
| D2 | Process Layer | 1.67 | Workflow and gates are weak |
| D3 | Engineering Methods | 2.00 | Spec/context/verification still individual-driven |
| D4 | Tools Layer | 2.67 | Relatively ahead |
| D5 | Harmony | 1.67 | Risk routing and collaboration contract insufficient |
| D6 | Organization & Culture | 2.00 | Training and knowledge assets not yet mechanized |
The global signal is even more stark: 16 of the 18 items fall at L1/L2, and L4/L5 is zero. This isn’t a “buy more tools” signal — it’s Type A: tools relatively ahead, process and Harmony weak.
Drilling further into the capability-item heatmap — domain averages can mask individual weak spots, but the heatmap doesn’t:
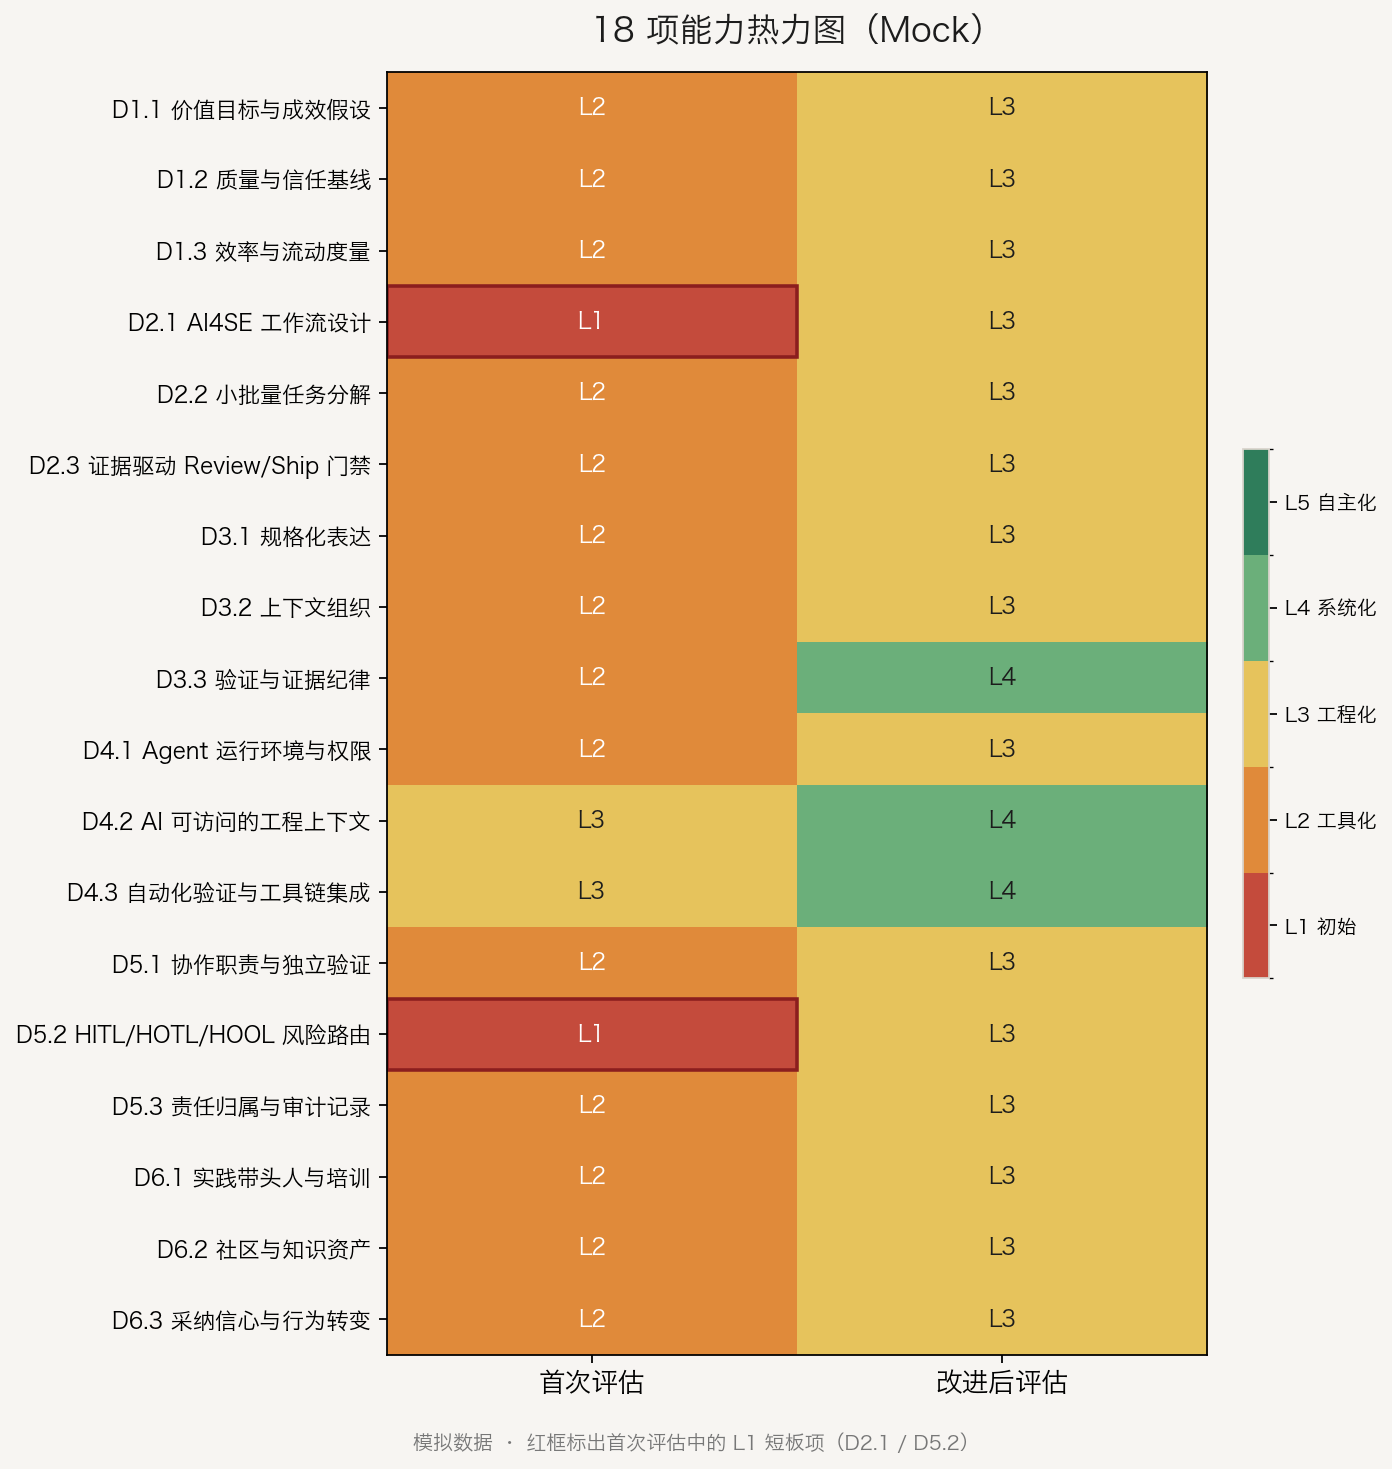
At the item level, the weak spots are very specific (highlighted in red in the chart):
- D2.1 AI4SE workflow design: L1 (still at individual-usage stage)
- D5.2 HITL/HOTL/HOOL risk routing: L1 (no risk tiering in place)
- D4.2 / D4.3: already at L3 (context and verification pipeline relatively ahead)
The first prescription drawn from this should target D2 and D5, not keep piling onto D4: turn individual usage into a team workflow, upgrade “everyone eyeballs it” into tiered risk routing with an auditable accountability chain, and simultaneously fill in spec/context/verification templates (D3) and value hypotheses (D1).
3. Post-Improvement Assessment: Look at Cleared Weak Spots, Not Just a Rising Average
| Metric | First Assessment | After Improvement |
|---|---|---|
| L1/L2 capability items | 16 | 0 |
| L4/L5 capability items | 0 | 3 |
| Six-domain profile | ~L2 range, D4 slightly ahead | All at or near L3, D3/D4 locally reaching L4 |
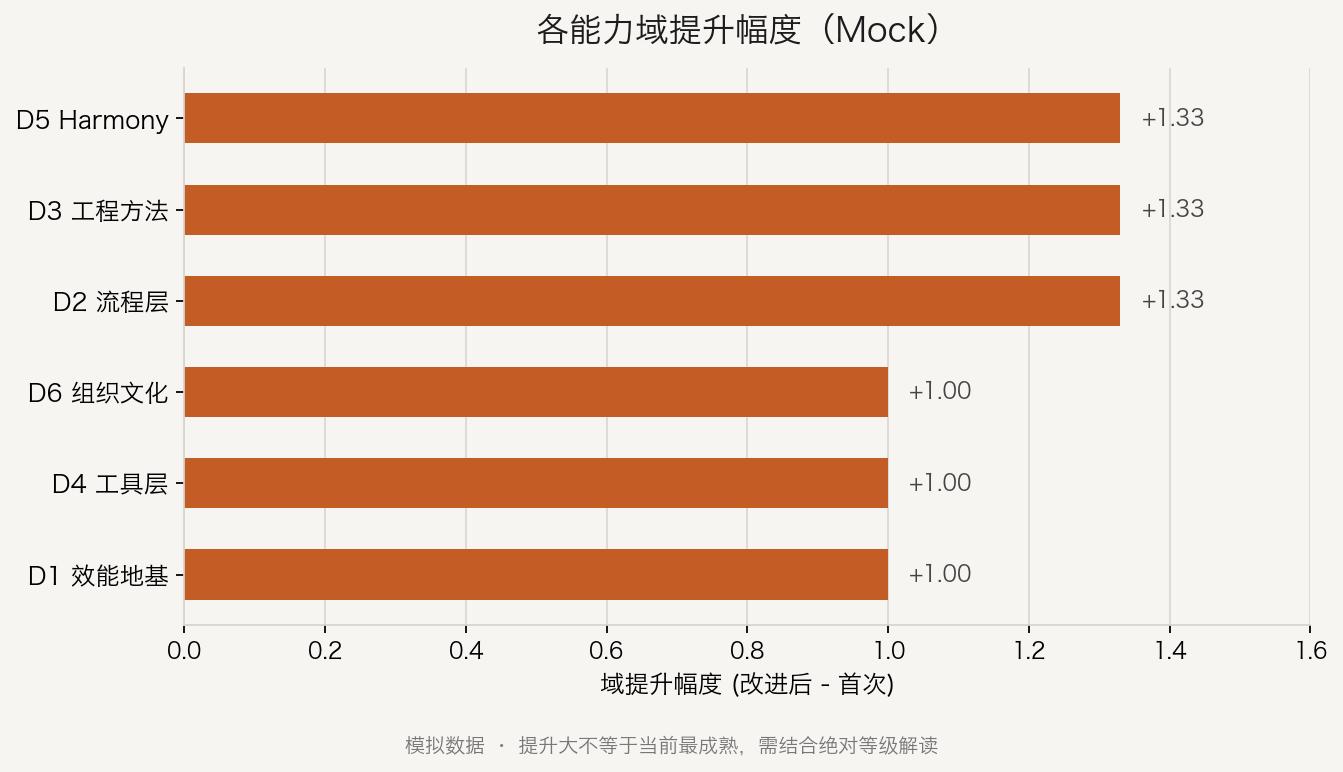
The domains with the largest gains are D2 / D3 / D5 (roughly +1.33). This matches the prescription direction: the weak domains were prioritized for improvement. The right-hand column of the heatmap shows items that locally reached systematization:
- D3.3 Verification and evidence discipline → L4 (evidence now feeds into review and delivery decisions)
- D4.2 / D4.3 → L4 (context is controlled and maintainable; AI-assisted changes stably enter the verification pipeline)
When reading the charts, it helps to consistently ask three questions:
- What does the shape look like? (Type A/B/C or some combination) — start with the radar chart and dashboard
- Which items are dragging things down? (the lowest items and the L1/L2 list) — then check the heatmap’s red zones
- Can the evidence hold up? (would low evidence, insufficient coverage, or incremental-evidence gaps make a “high score” unexplainable)
A rising domain average with L1/L2 items still numerous means the weak spots haven’t actually been cleared; more L4/L5 items with risk routing still empty means the autonomy narrative is running ahead of governance. A good re-assessment proves the prescription worked — not that the score looks good.
X. Wrap-Up: Assessment in Service of Actionable Capability Building
The design choices behind AI4SE Maturity Model v0.3.5 can be summed up in four points:
- Use 6×18 to align with the layered engineering structure, avoiding assessing only tools or only culture.
- Cap using evidence and coverage, avoiding treating plans, demos, and individual heroics as team capability.
- Output profile and gaps, not a total score, avoiding letting rankings substitute for diagnosis.
- Read the assessment as a typed prescription: different maturity, different weak spots, genuinely different improvement plans and doses.
Back to the opening analogy: patients may all have “a cold,” but a good doctor still asks about history, constitution, and complications before deciding on a different dose or a different treatment. Every team is “using AI” — professional AI4SE improvement should work the same way: diagnose the type first, then build capability case by case.
Related reading: